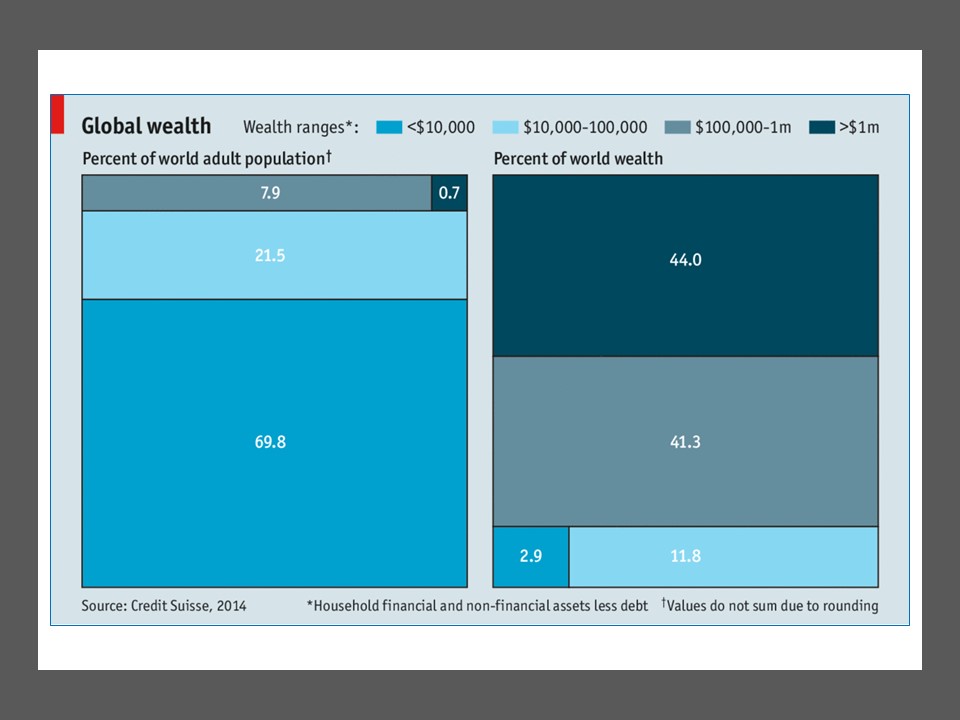
These statistics on the left were published in The Economist in 2014. Their source was the bank Credit Suisse. They illustrate a shocking fact: 0.7% of the adult world population owns 44% of the wealth in the world and 7.9% owns 41+%. This means that less than 10% owns 85+% of all the wealth.
To put it another way: 70% of the adult world population owns 3%. Today [2021] these figures do not differ substantially; if they do, they are even worse. In the past 40 – 50 years inequality has increased between countries. But also within societies. Which has led to many forms of social problems and growing social unrest.
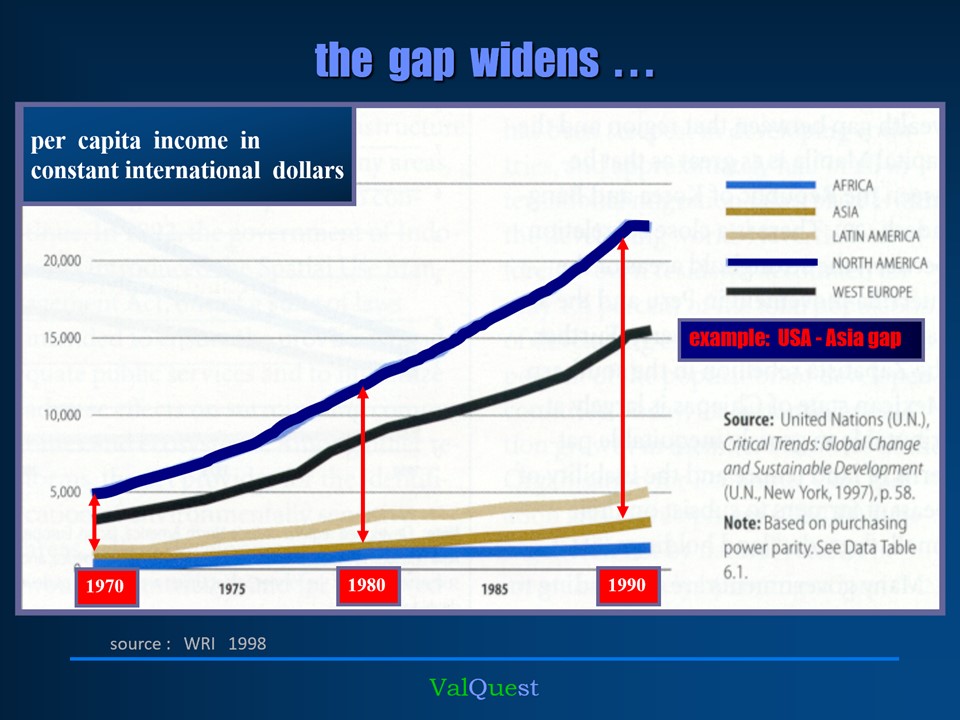
.Picketty´s 2013 book “Capital in the Twenty-First Century” became an international bestseller. It argues that the rate of capital return in developed countries is persistently greater than the rate of economic growth. Which will cause wealth inequality to increase even further. Many reviewers were genuinely outraged by this observed development, which was new to them. Which surprised me, because already in 1998 the World Resource Institute confronted me with the accompanying graph that illustrated the ever-growing inequality [albeit of income instead of wealth].
Inequality is increasing between continents, and between countries, but also within countries – within societies. In my country, The Netherlands, this is unfortunately also the case…
Just as in the USA:
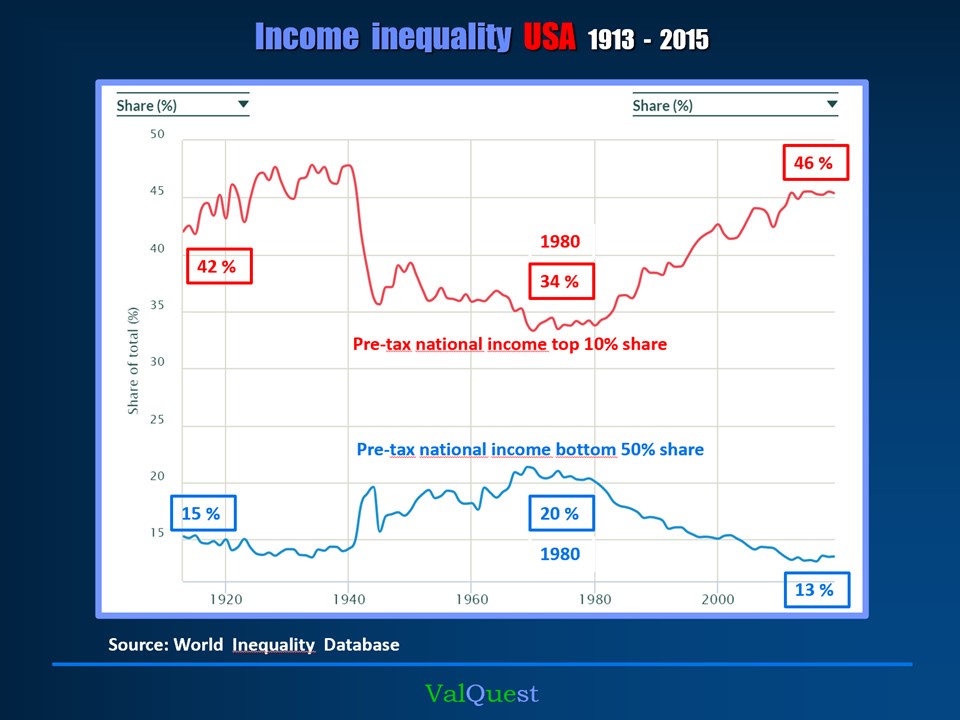
income inequality USA 1913 - 2015
Between 1940 and 1980, the share of the top 10% earners fluctuated around 35% of total income. From the beginning of the eighties it then steadily rose to 46%, the top-level just before the second world war. The share of the bottom 50% of earners fell steadily from a modest 20% level they enjoyed in 1980 to a meager 13% in 2015.
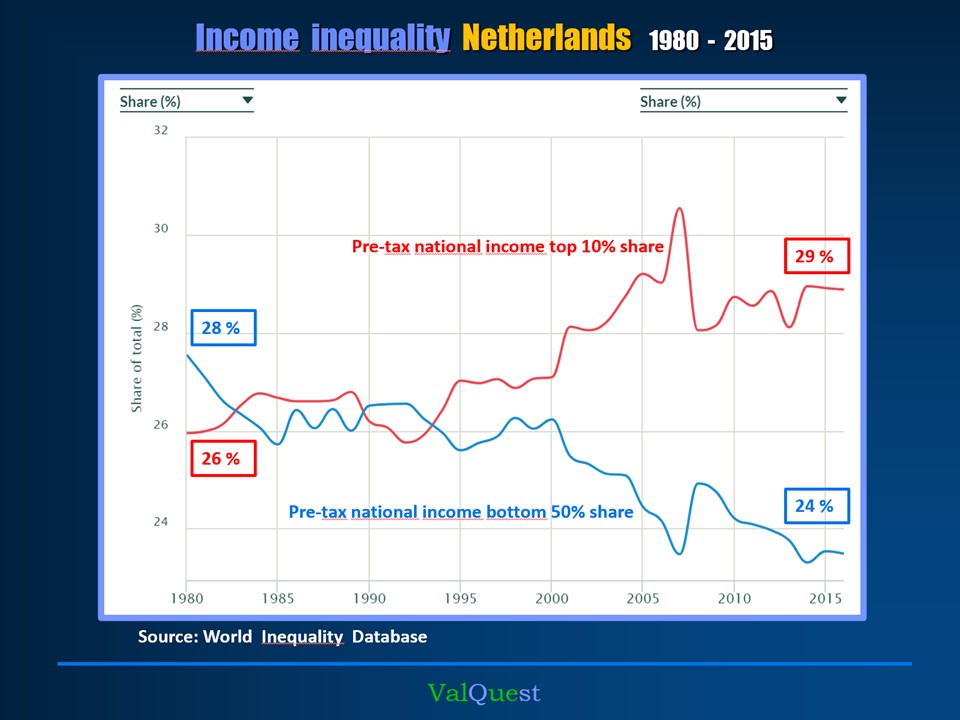
income inequality Netherlands 1980 - 2015
For The Netherlands, I, unfortunately, do not have data available before 1980. Between that year and 2000, both groups had a share of the total income of around 27%, but after that, a clear gap grew. It must be noted however that the gap in The Netherlands is about 5% versus 33% in the USA.
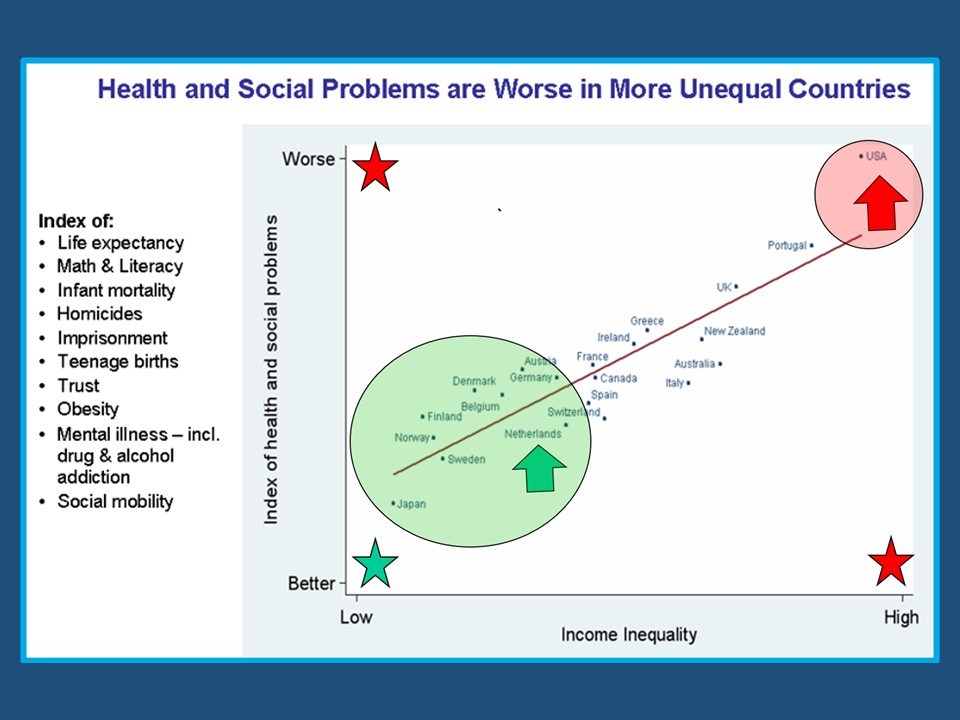
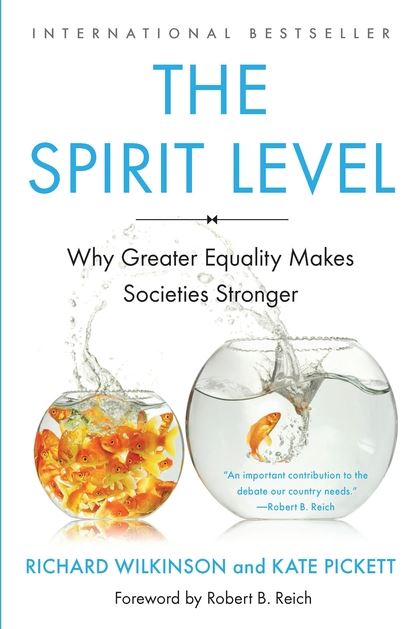
“The Spirit Level: Why Equality is Better for Everyone” was first published in 2009 and is one of the most talked-about books on society in the last decade. Why do people mistrust each other more in the USA than in Japan? The answer: inequality. The book argues that almost everything – from life expectancy to mental illness, violence to illiteracy – is not affected by the wealth level of society, but how equal it is. The more unequal, the more health and social problems.
The book caused great interest – and commotion. The research carried out by Wilkinson and Pickett is by no means uncontroversial and has been harshly criticized for its methodology approach. Taking that criticism into account, I continue to find the results of their research – at least on important parts – remarkable.
The most important key messages from this UN report [selected citations]:
Since 1990, income inequality has increased in most developed countries.
Income inequality among countries has declined in relative terms but is still higher than inequality within most countries.
Absolute income differences between countries continue to grow.
The world is far from the goal of equal opportunity for all: circumstances beyond an individual’s control, such as gender, race, ethnicity, migrant status, and, for children, the socioeconomic status of their parents, continue to affect one’s chances of succeeding in life.
Unless progress accelerates, leaving no one behind will remain a still distant goal by 2030.
High or growing inequality not only harms people living in poverty and other disadvantaged groups. It affects the well-being of society at large.
Highly unequal societies grow more slowly than those with low inequality and are less successful at reducing poverty.
Rising inequality has created discontent, deepened political divides, and can lead to violent conflict.